Minitab®
Procedure Section
A t-interval for a population mean provides an interval of estimates of the unknown population mean μ.
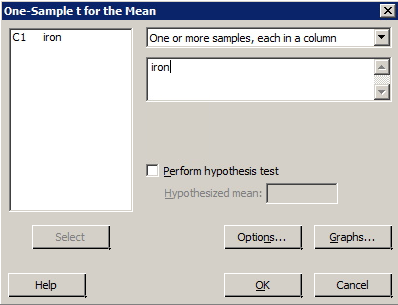
- Select Stat > Basic Statistics > 1 Sample t ...
- Use the pull-down options to select, 'Samples in columns.'
- Select the variable you want to analyze, (by double-clicking, or highlighting and clicking once on 'Select'.) so it appears in the box labeled 'Variables'.
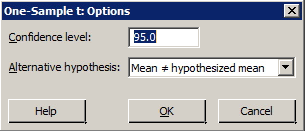
- Select 'Options' ... Type in the desired confidence level the default is 95.0 in the box labeled 'Confidence level'. (Ignore the box labeled 'Alternative'.)
- Select OK.
- Select OK. The output will appear in the session window.
Example Section
The US National Research Council currently recommends that females between the ages of 11 and 50 intake 15 milligrams of iron daily. The iron intakes of a random sample of 25 such American females are found in the dataset irondef.txt. With 95% confidence, what is the mean iron intake of all American females?
Minitab Dialog Boxes


Sample Minitab Output
One-Sample T: iron
| Variable | N | Mean | StDev | SE Mean | 95% CI |
|---|---|---|---|---|---|
| iron | 25 | 14.300 | 2.367 | 0.473 | (13.323, 15.277) |