Minitab® – Procedure
You may need to find a t critical value if you are using the critical value approach to conduct a hypothesis test that uses a t-statistic.
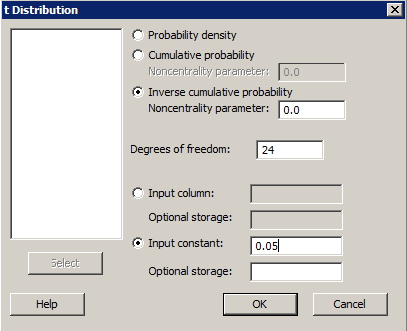
- Select Calc >> Probability Distributions >> t ...
- Click the button labeled 'Inverse cumulative probability'. (Ignore the box labeled 'Noncentrality parameter'. That is, leave the default value of 0 as is.)
- Type in the number of degrees of freedom in the box labeled 'Degrees of Freedom'.
- Click the button labeled 'Input Constant'. In the box, type the cumulative probability for which you want to find the associated t-value.
- Select OK. The t-value will appear in the session window.
Example
The US National Research Council currently recommends that females between the ages of 11 and 50 intake 15 milligrams of iron daily.
Is there evidence that the population of American females is, on average, getting less than the recommended 15 mg of iron? That is, should we reject the null hypothesis H0: μ = 15 against the alternative HA: μ < 15?
The iron intakes (irondef.txt) of a random sample of 25 such American females yielded a t-statistic of -1.48.
If we were interested in calculating the test at the α = 0.05 level, what is the appropriate t-critical value to which we should compare the t-statistic?
Minitab Dialog Box

Sample Minitab Output
Inverse Cumulative Distribution Function
Student's t distribution with 24 DF
| P ( X ≤ x) | x |
|---|---|
| 0.05 | -1.71088 |