Minitab® – Procedure
Creating a matrix of scatter plots between a set of variables is a good way to visualize the relationship between each pair of variables.
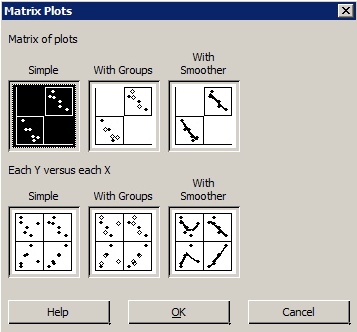
- Select Graph >> Matrix plot...
- Under Matrix of plots, select the Simple plot.
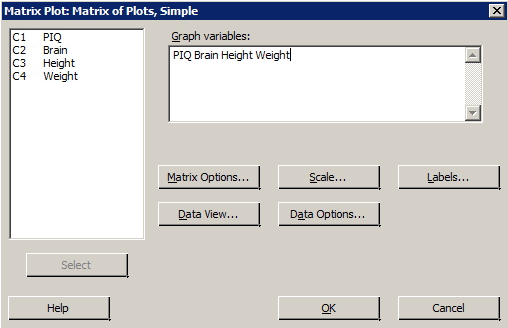
- In the box labeled Graph variables, specify the variables you want to include in your plot.
- Select OK. A new graph window should appear containing the scatter plot matrix.
Example
Using the dataset iqsize.txt, create a matrix of scatter plots between each pair of the four variables.
Minitab dialog boxes
Resulting scatter plot matrix
