Minitab® – Procedure
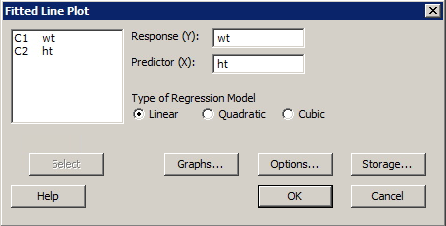
- Select Stat >> Regression >> Fitted line plot...
- Specify the response and the predictor.
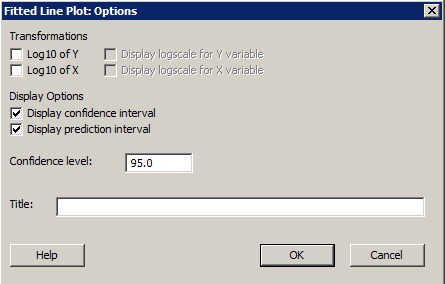
- Select Options... Under Display Options, select Display confidence interval and select Display prediction interval. Specify the desired confidence level — 95% is the default. Select OK.
- Select OK. A new window containing the fitted line plot will appear.
Example
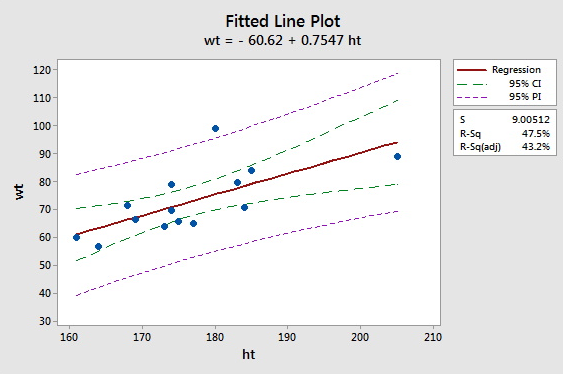
For people of the same age and gender, height is often considered a good predictor of weight. The data set htwtmales.txt contains the heights (ht, in cm) and weights (wt, in kg) of a sample of 14 males between the ages of 19 and 26 years.
- Find a 95% prediction band for the weight of a randomly selected male, aged 19 to 26.
- Find a 95% confidence band for the average weight of all males, aged 19 to 26.
Minitab Dialog Boxes
Sample Minitab Output Plot